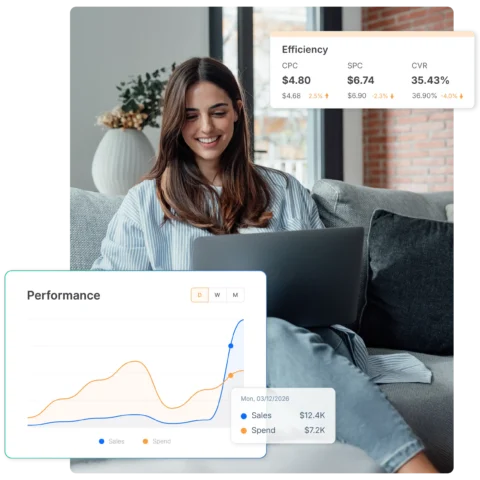
Activate Kroger Media with Shopper Precision
Plan, activate, and optimize Kroger Precision Marketing campaigns using first-party shopper data, audience targeting, and closed-loop measurement.
Book time with a commerce expert
With a personalized walkthrough, we will show how the Pacvue Commerce Operating System helps brands and agencies grow sales, increase market share, and boost profitability at enterprise scale.
-
Maximize cross-retailer performance by planning, executing, and analyzing campaigns with precision across 100+ retailers.
-
Accelerate growth with unified commerce data, creating a single source of truth to track performance, identify opportunities, and optimize decisions.
-
Protect profitability with visibility into operational performance and revenue recovery opportunities.
-
Turn insights into market share gains with real-time competitor tracking, Share of Voice analysis, and actionable commerce intelligence.


Drive measurable growth on Kroger’s most valuable audiences.

Audience-Driven Activation
Activate campaigns using Kroger’s first-party shopper data to reach high-value audiences.
Closed-Loop Measurement
Measure performance across online and in-store sales with closed-loop attribution.

Automation & Optimization
Optimize bids, budgets, and targeting with automation and performance signals.
All-in-One Kroger Execution
How Pacvue powers Kroger performance
Activate campaigns with shopper-level precision

Understand what drives in-store and online sales

Optimize campaigns with data-driven automation on Kroger


Unlock Kroger growth in one Commerce Media OS.
Plan, activate, and optimize Kroger campaigns using first-party shopper data, closed-loop measurement, and real-time performance signals.
Audience Activation
Activate campaigns using Kroger’s first-party shopper data to reach high-intent audiences across search and display.
Shopper & Sales Intelligence
Track SKU-level sales by region, banner, and store sub-brand to understand where growth is happening.
Closed-Loop Measurement
Measure in-store and online sales using Kroger Offline Metrics to quantify true incremental impact.
Competitive Performance Insights
Analyze Share of Voice, Win Rate, and Time Live to identify competitive gaps and opportunities.
Automated Campaign Execution
Scale performance with rules-based automation, dayparting, and real-time optimization.
Pacvue powers unified commerce execution at scale
Proven performance lift across leading brands & agencies.
Insights shaping the future of commerce
Explore trends, benchmarks, and perspectives shaping retail media and commerce.
Blog: The 2026 Commerce Outlook: How AI, DSP, and Commerce Platforms Drive Performance
Read now.
Blog: The Next Era of Retail Media Optimization: How AI Turns Retail Media into a Growth Engine
Read now.
Blog: Discovery Commerce in Retail Media: How Search & Discovery Are Changing in 2026
Read now.
Blog: The New Performance Standard: Incrementality, iROAS & Precision Optimization in Retail Media
Read now.
Blog: From Data Complexity to Clarity: How Commerce Intelligence Unlocks Growth
Read now.Ready to grow your business on Kroger?
Activate, optimize, and measure Kroger campaigns with precision and control